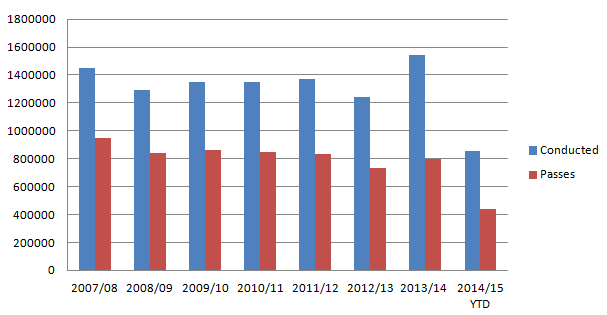
In case you were wondering, the theory test is no walk in the park. In fact, as the graph below shows, the car theory test pass rate has declined over recent years. So much so that it is only around half of the attempts at the test which result in a pass. So make sure you prepare yourself as best you can with our practise theory test.
| Car theory test pass rates annual summary | |||
|---|---|---|---|
| Total tests conducted | Passes | Pass rate (%) | |
| 2007/08 | 1,451,315 | 949,409 | 65.4 |
| 2008/09 | 1,290,614 | 844,022 | 65.4 |
| 2009/10 | 1,347,463 | 859,802 | 63.8 |
| 2010/11 | 1,346,140 | 848,992 | 63.1 |
| 2011/12 | 1,371,475 | 833,916 | 60.8 |
| 2012/13 | 1,244,021 | 735,356 | 59.1 |
| 2013/14 | 1,541,896 | 795,245 | 51.6 |
| 2014/15 YTD | 857,675 | 440,724 | 51.4 |
And females are more likely to pass their test. As you can see from the table below they are consistently out in front year on year.
| Car theory test pass rates by gender, annual summary | ||
|---|---|---|
| Males (%) | Females (%) | |
| 2007/08 | 62.3 | 68.9 |
| 2008/09 | 62.6 | 68.7 |
| 2009/10 | 61.1 | 66.9 |
| 2010/11 | 60.4 | 66.0 |
| 2011/12 | 58.1 | 63.7 |
| 2012/13 | 56.2 | 62.3 |
| 2013/14 | 48.8 | 54.7 |
| 2014/15 YTD | 48.6 | 54.5 |
The pass rates can also be broken down by location as shown below.
| Car theory test pass rates (%) by location | |
|---|---|
| Covers April - Sept 2014 | |
| Aberdeen | 53.9 |
| Aberystwyth | 49.3 |
| Aldershot | 51 |
| Ayr | 52.7 |
| Bangor | 50.8 |
| Barnstaple | 51.4 |
| Barrow | 49.7 |
| Basildon | 48.1 |
| Berwick | 47.1 |
| Birmingham | 48.5 |
| Blackpool | 51.8 |
| Bolton | 51 |
| Boston | 45.1 |
| Bournemouth | 53.6 |
| Bradford | 47.1 |
| Brighton | 57 |
| Bristol | 51.6 |
| Builth Wells | 55 |
| Bury St Edmunds | 52.4 |
| Cambridge | 55.1 |
| Canterbury | 52.6 |
| Cardiff | 51.9 |
| Carlisle | 51.5 |
| Chatham | 50.2 |
| Chelmsford | 53.3 |
| Cheltenham | 53.9 |
| Chester | 52.8 |
| Chesterfield | 50.5 |
| Coventry | 50.2 |
| Crawley | 49.8 |
| Croydon | 50.4 |
| Derby | 52.2 |
| Doncaster | 48 |
| Dudley | 50.1 |
| Dumfries | 52.2 |
| Dundee | 54.5 |
| Eastbourne | 52.9 |
| Edinburgh | 56.7 |
| Elgin | 48.1 |
| Exeter | 53.4 |
| Fareham | 52.8 |
| Fort William | 55.7 |
| Galashiels | 54.1 |
| Glasgow | 54 |
| Gloucester | 50.8 |
| Grantham | 53.2 |
| Greenock | 52.3 |
| Grimsby | 50.2 |
| Guildford | 56 |
| Harlow | 49.2 |
| Harrogate | 54.1 |
| Hastings | 51.5 |
| Haverfordwest | 50.1 |
| Helmsdale | 68.2 |
| Hereford | 52.6 |
| Huddersfield | 50.7 |
| Hull | 49.7 |
| Huntly | 50.4 |
| Ilford | 47.8 |
| Inverness | 53.2 |
| Ipswich | 50.8 |
| Isle of Arran | 52.4 |
| Isle of Benbecula | 54.2 |
| Kings Lynn | 45.6 |
| Kingston | 54.6 |
| Kirkwall | 49.3 |
| Kyle of Lochalsh | 23.1 |
| Leeds | 51.7 |
| Leicester | 49.1 |
| Lerwick | 55 |
| Lincoln | 52.7 |
| Liverpool | 51.5 |
| Lowestoft | 47.4 |
| Luton | 46.8 |
| Manchester | 52.7 |
| Mansfield | 49.6 |
| Merthyr Tydfil | 49 |
| Middlesbrough | 50.5 |
| Milton Keynes | 50.3 |
| Morpeth | 51.1 |
| Newcastle | 53.8 |
| Newport (Gwent) | 50.6 |
| Newport-Isle Wight | 52.1 |
| Northampton | 49.8 |
| Norwich | 54.1 |
| Nottingham | 53.5 |
| Oban | 60.1 |
| Oldham | 48.4 |
| Oxford | 54.3 |
| Penzance | 50.7 |
| Peterborough | 50.7 |
| Pitlochry | 55.8 |
| Plymouth | 52 |
| Portree | 50 |
| Portsmouth | 49.8 |
| Preston | 52.7 |
| Reading | 53.1 |
| Redditch | 51 |
| Rhyl | 49.1 |
| Salford | 54.3 |
| Salisbury | 52.6 |
| Scarborough | 49 |
| Scunthorpe | 47.2 |
| Sheffield | 52.5 |
| Shrewsbury | 51.2 |
| Sidcup | 51.4 |
| Slough | 49.7 |
| Southampton | 52.4 |
| Southend on Sea | 51.8 |
| Southgate | 51 |
| Southport | 53.2 |
| Southwark | 55.1 |
| St Helens | 50.8 |
| Staines | 50.6 |
| Stevenage | 49.7 |
| Stirling | 52.5 |
| Stockport | 51.8 |
| Stoke-on-Trent | 50.5 |
| Stornoway | 44.9 |
| Stranraer | 48.9 |
| Stratford uponAvon | 53.7 |
| Sunderland | 52.4 |
| Sutton Coldfield | 51.1 |
| Swansea | 50.6 |
| Swindon | 49.5 |
| Tarbert | 50.6 |
| Taunton | 52.6 |
| Torquay | 51.3 |
| Truro | 54.2 |
| Ullapool | 64 |
| Uxbridge | 47.3 |
| Watford | 51.4 |
| Weymouth | 49.1 |
| Wick | 47.9 |
| Wigan | 51.5 |
| Wolverhampton | 49.7 |
| Worcester | 52.3 |
| Workington | 47.4 |
| Worthing | 50.9 |
| Yeovil | 50 |
| York | 56.3 |
| National | 51.4 |
Source: DVSA, December 2014.